Server Status Checker
Paste a full URL and the checker sends a request from our server, then shows the HTTP status code, the status text and how many milliseconds the response took. Below that you get the Server, Content-Type, X-Powered-By and Cache-Control headers when the site sends them.
Updated · by the Linkstonic team
What the checker asks and what it reports
The request goes out from Linkstonic's server, so the answer reflects what the wider internet sees, not your own connection.
HEAD, not GET
The tool sends a HEAD request, which asks for headers only and skips the page body. It is fast and light on the server. A few servers and firewalls answer HEAD differently from GET, returning 405 or 403, so a strange code here is worth double-checking in a browser.
Color by class
The big number is colored by status class: green for 2xx, blue for 3xx redirects, amber for 4xx client errors and red for 5xx server errors. If no response comes back at all, the code shows as a dash and the site is marked down.
Up or down
A green check means the server replied and the tool counted it as up. A red cross means it did not reply or replied with a failure. The badge on the right is the round-trip time in milliseconds from our server to yours.
Headers shown
Four headers are pulled out: Server, Content-Type, X-Powered-By and Cache-Control. Any header the site doesn't send is left off rather than shown empty, so a short list simply means the server is sparing with what it reveals.
Include the scheme
The box starts with https:// for a reason. Enter the exact URL you care about, including the path. The root domain can be up while /checkout returns 500, and http:// and https:// can behave differently on the same host.
What a healthy page returns
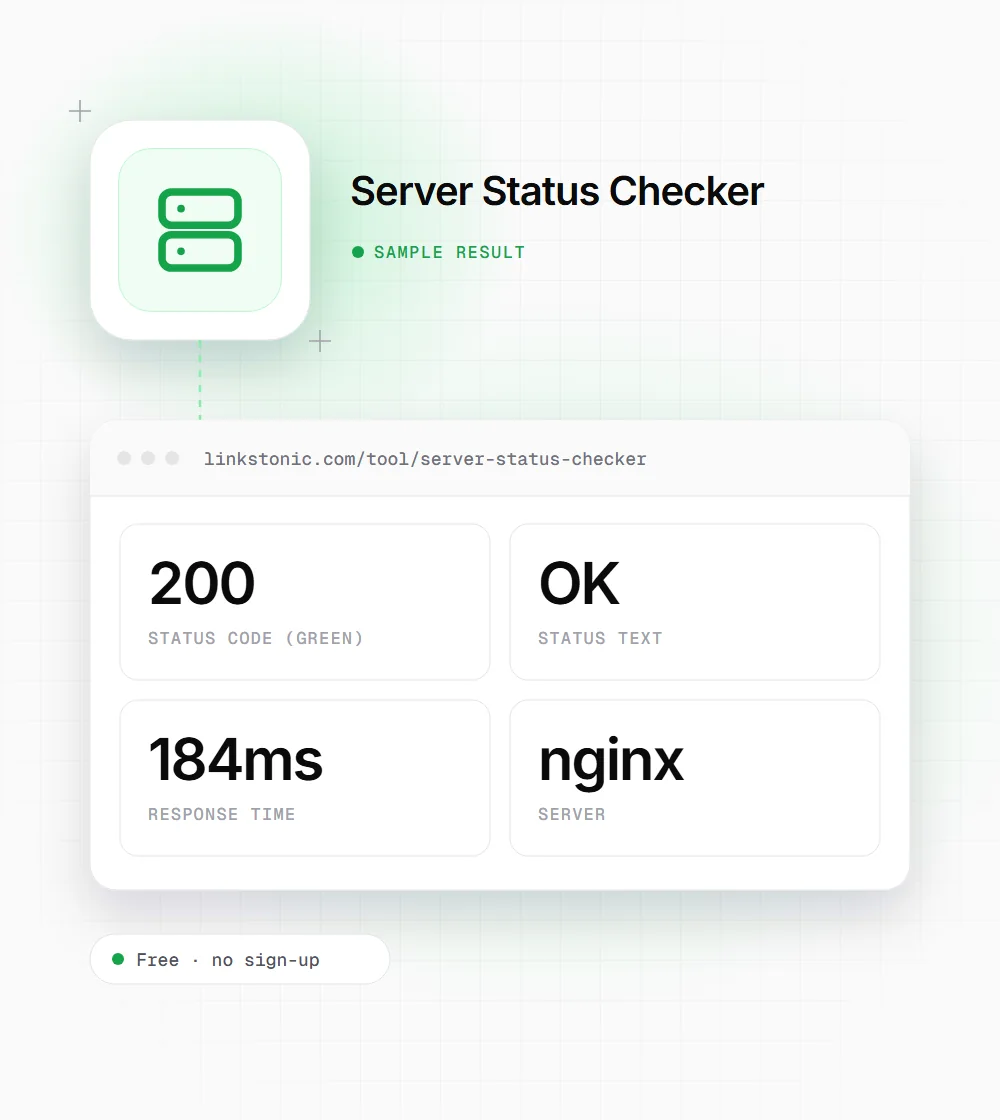
An illustrative result for a made-up site, to show how the panel reads. Your numbers will differ.
https://www.example.com/pricing
X-Powered-By is missing from the list because the server doesn't send it. That is a good sign, since advertising your PHP or framework version helps attackers more than anyone else.
When people reach for it
A status check is small, but it settles a lot of arguments quickly.
Down for everyone or just me
If the site won't load in your browser but the checker gets a 200, the problem is on your side: DNS cache, VPN, office firewall or ISP. If the checker fails too, it is time to call the host.
SEO audits
Spot-check pages that dropped out of Google. A 404, a 5xx or a surprise redirect on a key URL explains a lot of lost traffic, and it takes a few seconds to confirm.
Developers after a deploy
Confirm the new release answers with 200, the right Content-Type and the Cache-Control you set, before customers start reporting problems.
Status codes you'll see most
These are the codes that come up in day-to-day SEO and site monitoring, and what each one usually means for a crawler.
| Code | Meaning | What to do |
|---|---|---|
| 200 | OK, the page was served | Nothing, unless you expected a redirect |
| 301 | Moved permanently | Fine for old URLs; update internal links to the target |
| 302 / 307 | Temporary redirect | Use 301 or 308 if the move is permanent |
| 403 | Forbidden | Check firewall, bot rules or file permissions |
| 404 | Not found | Redirect it if the page moved, or let it 404 if it's gone |
| 410 | Gone | Tells crawlers the removal is deliberate |
| 500 | Internal server error | Check the application and server error logs |
| 503 | Service unavailable | Fine for short maintenance; long stretches hurt crawling |
Codes come from the HTTP standard. Some servers bend the rules, for example serving an error page with a 200 code.
The status code is what crawlers believe
People judge a page by how it looks. Googlebot and AI crawlers judge it by the status code first. A page that renders fine but answers 404 gets dropped from the index, and a page that shows "not found" text but answers 200 is a soft 404 that wastes crawl time. I check the code before I read anything else on a page that isn't ranking.
Server errors are the ones to watch. Google has said that repeated 5xx responses make Googlebot slow its crawl rate, and pages that keep failing can fall out of the index. A 503 during a short maintenance window is fine and is the right code to use. A week of 500s is not.
One HEAD request is a snapshot, not monitoring. It tells you what happened at that moment from one location. If a site flaps, or blocks some bots but not others, a single check can miss it. Crawlers used by ChatGPT, Perplexity and Gemini often come from cloud IP ranges, so a site that blocks data-center traffic may pass in your browser and fail for them.
Reading an odd result
Most checks come back 200. When one doesn't, this is where I'd look first.
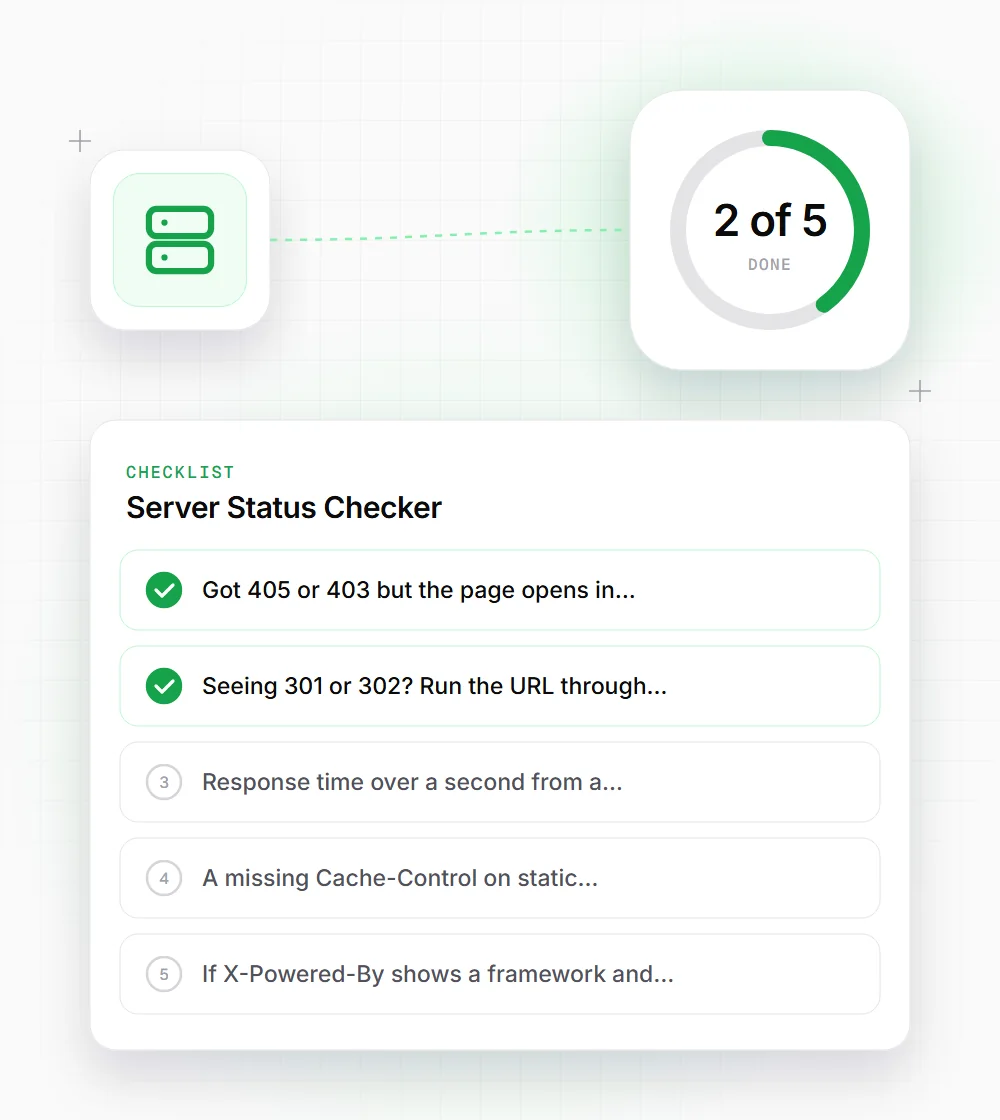
- 01
Got 405 or 403 but the page opens in your browser? The server may reject HEAD requests. Test with a GET-based tool before panicking.
- 02
Seeing 301 or 302? Run the URL through a redirect chain checker to see where it ends up and how many hops it takes.
- 03
Response time over a second from a simple page usually points at slow hosting or an uncached backend.
- 04
A missing Cache-Control on static pages is a quick win. Ask your developer to set one.
- 05
If X-Powered-By shows a framework and version, consider hiding it in the server config.