Private by design
No cookies, no PII, no user identifiers. We store performance timings and events on our servers, keyed to a site ID and nothing else.
Add one async snippet and RUM Monitor records the JS errors, failed requests, layout shifts, long tasks and rage clicks your visitors run into. It uses no cookies, collects no PII and assigns no user identifiers.
Sample dashboard for illustration
Collected from real visitors
A lab test loads one page on one profile. RUM Monitor shows what happens to your actual visitors, on their own phones, laptops and flaky connections.
No cookies, no PII, no user identifiers. We store performance timings and events on our servers, keyed to a site ID and nothing else.
When someone clicks the same spot over and over, something is wrong. Rage clicks lead you to the broken button or the element that looks clickable but isn't.
Paste one async script tag into your site's <head>. Status changes from Pending to Verified as soon as the first visitor loads a page.
It all feeds a 7-day dashboard that keeps updating, covering everything from the errors people hit to how far down the page they scroll.
The top JavaScript exceptions and the top failed network and API requests. These are the errors users hit in production, which are rarely the ones you saw in staging.
/checkout · Chrome, Safari
Site-wide · blocked script
Failed request · /product/*
Failed request · site-wide
Cumulative Layout Shift and long tasks that block the main thread, measured on real visits. It's field data for the same Core Web Vitals Google looks at.
Layout shift · ad slot loads late
Layout shift · web font swap
Long tasks over 50ms per visit
Layout shift · stable
Rage click coordinates show which element people keep hammering. Scroll depth tells you whether they ever get to the part of the page you care about.
Rage clicks · /checkout · mobile
Rage clicks · /pricing
Rage clicks · image looks clickable
How far visitors get down the page
Sessions, average session length, bounce rate, scroll depth and a device breakdown, all in the same 7-day summary.
PageSpeed simulates a page load from Google's servers. RUM Monitor records what your visitors actually get. You want both, because they answer different questions.
One test load from Google's servers.
Every real visit, on real devices.
Debugging a page's load before or after a release.
Run an SEO auditSeeing what visitors actually experience, every day.
Start monitoringType your domain into RUM Monitor, say yourbrand.com, and it gets its own site ID.
Copy the one-line script tag into the <head> of every page. It loads async, so your pages don't wait for it.
Status switches from Pending to Verified when the first page load comes in. From there the 7-day dashboard starts to fill up.
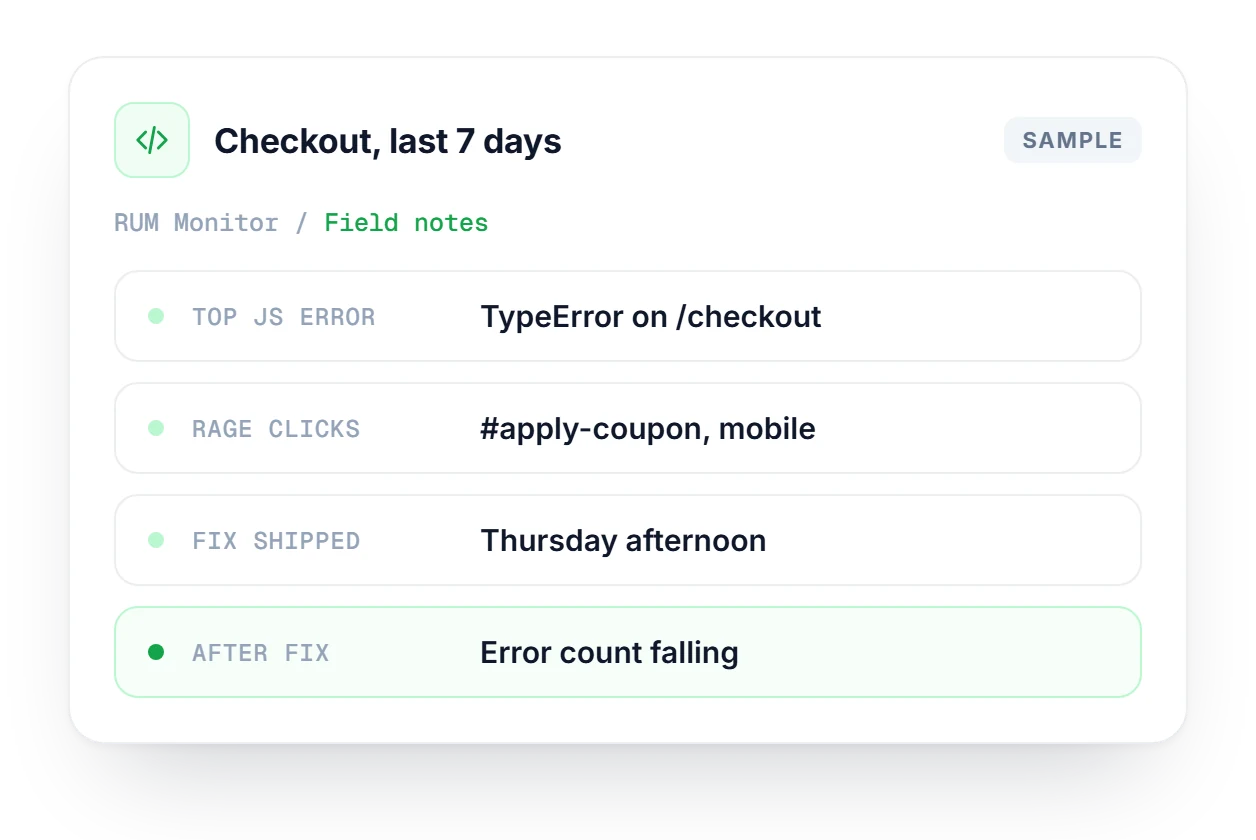
Orders drop on a Thursday and staging looks fine, so you open RUM Monitor for the last 7 days. A new TypeError on /checkout started the same day, and #apply-coupon is collecting rage clicks on mobile. Your developer ships a fix that afternoon, and over the next few days the error count falls away.
The lab side of the story: 14+ technical checks, PageSpeed and Core Web Vitals included, with an AI-written fix for each issue.
Explore SEO AuditScores, written insights and a chat you can ask plain questions, all built on your GA4 data.
Explore BehaviorMindCompare Core Web Vitals, on-page SEO and schema for your site and up to 3 competitors, side by side.
Explore Competitor AnalysisPrivacy, installation and what RUM Monitor measures.
See which plans include RUM Monitor and how many sites you can add.
Compare plans →Yes. RUM Monitor sets no cookies and collects no PII or user identifiers. It stores performance timings and events on our servers, tied only to your site ID, so there is nothing that points back to an individual visitor.
JS errors, failed requests, CLS measurements, long tasks, rage click coordinates, scroll depth, session duration and device type. That's the full list. It doesn't collect names, emails, IP-based identifiers or anything else personal.
It shouldn't. The script tag loads asynchronously, so the browser keeps rendering your page while it downloads. Visitors see your content first, and the snippet starts recording once it has loaded.
In WordPress, add it to your theme's header.php or use a header and footer plugin. In Shopify, add it to theme.liquid in the <head> section. Any platform that lets you edit the page <head> works.
PageSpeed is a lab simulation run from Google's servers on one test profile. RUM shows what your actual visitors get on their own devices and networks, including JS errors and rage clicks a lab test never sees. Use both.
Total events, JS errors, failed requests, sessions, average session length, average scroll depth, bounce rate and a device breakdown. It covers the last 7 days and keeps updating as new visits come in.
As soon as the first visitor loads a page with the snippet installed. On a busy site that usually means seconds. On a quiet one it can take a few minutes, or you can open the page yourself to trigger it.
Add your domain, paste one line into your <head> and start seeing the errors and dead clicks your visitors hit from the very first visit.
 GA4 · last 7 days