Direction beats a snapshot
Pick a date range and compare it with the one before. You see right away if AI visibility went up, down or nowhere.
Analytics lines up your tracking results as dashboards: share of voice over time, performance by engine, top keywords and competitor movement, plus AI-explained trends.


Sample dashboard for illustration
Every chart splits out by answer engine
ChatGPT
Claude
Gemini
Perplexity
Each tracking run is one data point. Put enough of them in a row and you can see momentum, compare periods and find the week a competitor started pulling ahead.
Pick a date range and compare it with the one before. You see right away if AI visibility went up, down or nowhere.
Narrow the dashboards to one brand or roll up every brand in the workspace. Agencies and multi-brand teams use this a lot.
Plenty of brands do well on ChatGPT and barely show up on Gemini. The platform breakdown shows where you stand.
Every view reads from your Track Keywords results and updates when you change the brand or date range.
Daily trend lines for your brand and your competitors. You can point to the day you started gaining or losing ground.
How your visibility splits across ChatGPT, Claude, Gemini and Perplexity. The weakest engine is usually where to work next.
The tracked keywords with the most AI mentions and the best visibility. Spend content time where you're close to breaking through.
Put any date range next to the period before it, metric by metric, and see which numbers moved and which stayed flat.
| Metric | This period | Previous | Change |
|---|---|---|---|
| Share of voice | 38% | 33.8% | ▲ 4.2 pts |
| Mentions | 312 | 264 | ▲ 18% |
| Avg visibility | 63 | 65 | ▼ 2 |
| Keywords with a mention | 41 | 41 | 0 |
Click Explain trends and every competitor gets a Rising, Falling or Stable badge, plus likely reasons and suggestions based on your tracking data.
A short, plain read on what changed and what you might do about it.
Each read carries a disclaimer. It is analysis to validate, and it does not prove cause.
Links take you to Track Keywords or Citation Gap, where you can confirm it with content and SERP checks.
Likely reasonMentions dropped on comparison queries after their pricing page changed.
SuggestionPublish a clear comparison page while their share is slipping.
Analytics reads your Track Keywords results. More tracking runs mean longer, more useful trend lines.
Look through share of voice trends, the platform split, top keywords and competitor comparison. Filter by brand or date range.
Click Explain trends for an AI read on competitor movement, then follow the links to Track Keywords or Citation Gap to check the details.
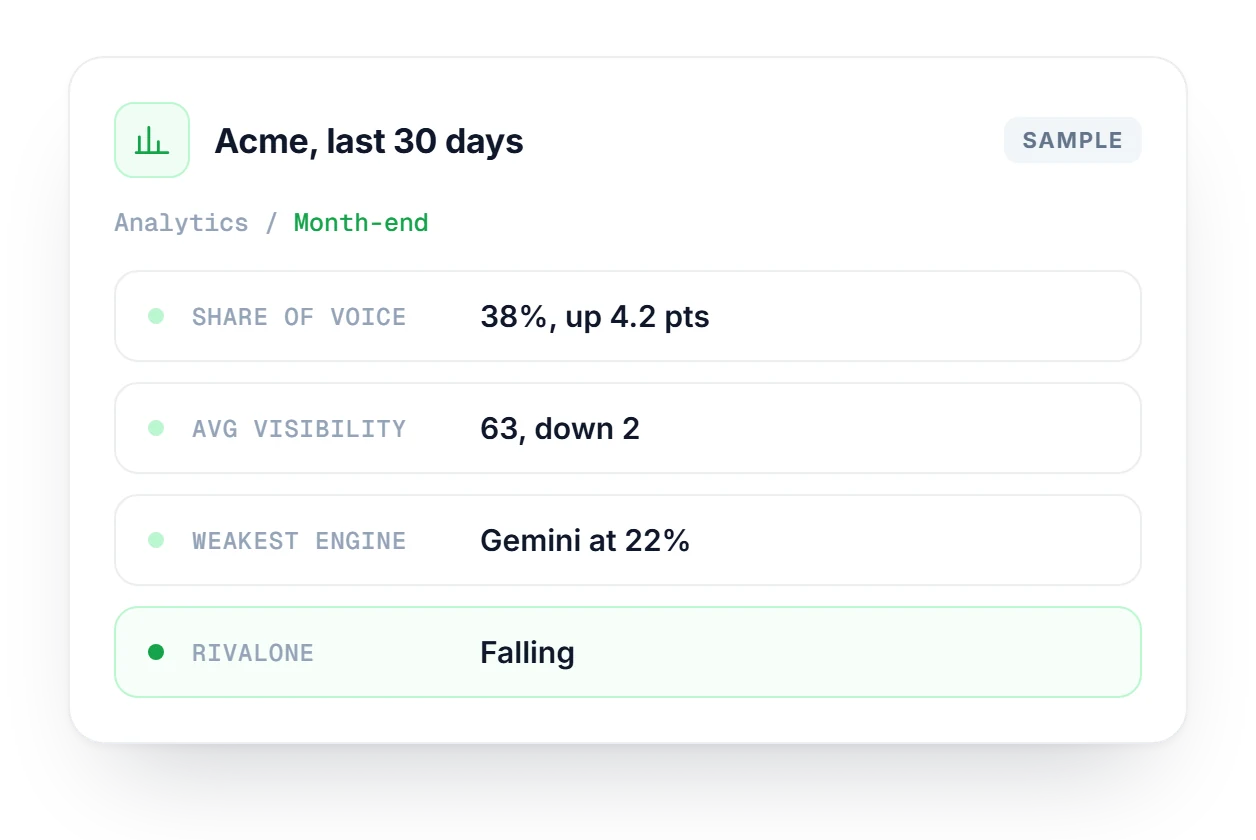
An agency owes Acme Coffee a monthly AI visibility report. Filter the dashboards to Acme, set 30 days and compare with the previous period: share of voice is up to 38% while average visibility slipped 2 points. The platform breakdown shows Gemini at 22%, well behind. Check every Explain trends reason, like RivalOne falling, before it reaches the report.
Where every dashboard gets its data. Add keywords by hand, CSV or Google Sheets and scan all four engines in parallel.
Explore Track KeywordsFind the keywords where AI cites a competitor instead of you, with live crawler checks, severity scores and fixes in priority order.
Explore Citation GapGet an email or Discord alert when an AI engine mentions your brand or your visibility changes.
Explore AlertsWhere the data comes from, how share of voice is measured and what Explain trends can and can't tell you.
See which plans include data export and multi-brand workspaces.
Compare plans →Yes. Analytics is built entirely from your Track Keywords results, so there is nothing to chart until you run a scan. Once your first tracking session finishes, data shows up in the dashboards right away.
Share of voice is your brand mentions divided by total mentions, meaning yours plus your competitors', across the keywords and platforms you track. It is shown as a percentage, so 38% means you got 38 of every 100 mentions.
It uses patterns in your actual tracking data plus an AI-generated interpretation of them. The app shows a disclaimer next to every read, because it's analysis you should validate and not proof of what caused a change.
Yes, on the Pro and Agency plans. Data export is included there, and the Pricing page lists the current export options for each plan so you can check what fits before you upgrade.
They measure different things. Google Analytics tracks what people do on your site after they click. Linkstonic Analytics tracks how often AI engines mention your brand in their answers, which happens before anyone visits.
Free to start, no credit card, no commitment. Track a few keywords and the dashboards start filling in after the first run.
 Sent to Discord